
Probably the most famous data journalist in Belgium, Maarten Lambrechts, has never attended a traditional journalism school. He graduated as a bio-engineer which gave him a sense of working with statistics and math. Later on he spent a few years in Latin America, where he started blogging and reading works of authors like Edward Tufte, paving his way to journalism. Back in Belgium, he started working for a monthly magazine as a website manager, and that is where he started experimenting with data visualizations. Few years later, these experiments became his full-time job in the Mediafin newsroom. It is located on the edge of downtown Brussels, taking half of the floor of what used to be a 19th century warehouse, and this is where we sit to talk about the ups and downs of data journalism.
You are particularly well known for creating data visualizations, why did you choose this particular craft among the other constituents of data journalism?
Perhaps because it is the final product that people see, and it is also interesting to follow books and new trends in this dynamic field. You can experiment and invent new data visualization forms. But you cannot just separate the visualization part from all the other steps of the data journalistic process, so I also know how to wrangle data, scrape data or search for stories in data.
Do data visualizations make communication in a bilingual Belgium easier for journalists?
Not really, because it is common for journalists to find a dataset from one part of the country, while there’s no countpart equivalent on the other side. But working here, in a bilingual company where we actually have two newspapers, it is common sense to publish in two languages. The main results I make are very visual and it is just a matter of translating small parts of the text.
What irritates you most about the open data you work with today?
I want to have more detailed data, non-aggregated data, and a lot of the times I don’t get that specific data because of privacy reasons. For example, we had an idea to do a project about dog names, and there is an entity that registers all dogs and all the breeds, so I asked them about this database. They gave me an excel file with aggregated data with aggregations based on breeds and names. When I asked about more details they said: no, this is all we can give to the press. I think there should not be any privacy issues with dog breeds. So sometimes people don’t know whether they should be handing out their data and stick to the rules. In the data I can use, I want every individual datapoint as a row, because if I have only sums of totals, I have trouble finding decent answers for questions I have as a journalist.
I have a question about data on the demography in Brussels. After the Paris attacks, you visualized the population characteristics of Molenbeek. Following up on that, a lot of people asked the question: How many “true Belgians” are actually living in Brussels. Can anyone access this data?
Indeed, “true Belgians” is a term that a lot of people are struggling with the interpretation. You have foreigners who don’t have a Belgian passport which are easy to count, but you also have nationalized people who have 2 passports, and you have the children of nationalized people and they just have the Belgian passport whereas their parents might be born in other countries. There are not a lot of statistics about that. It’s also a very sensitive topic in Belgium, so I don’t think they these kind of statistics are available just yet.
On your blog, you have a 'making-of' series about your visualizations, which is really interesting to follow. Why do you invest your time in documenting the making process?
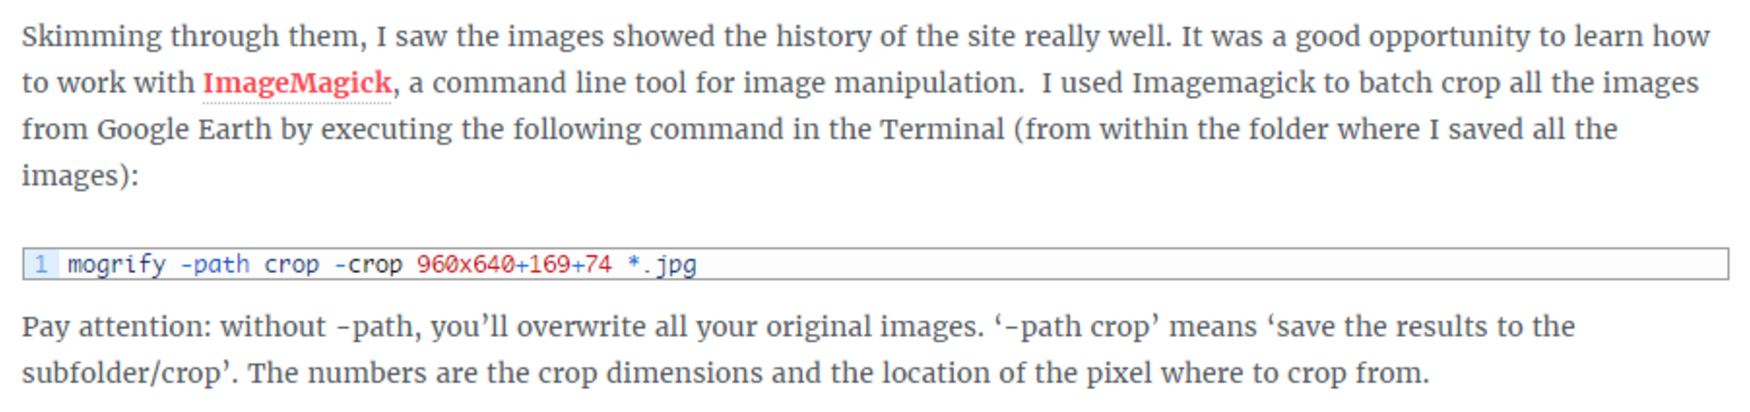
Part of one of the making-off blogposts on Maarten Lambrechts’ website
If you know where to look and what search terms to use, you can find all the things I talk about elsewhere on the internet. But usually it is not a lineair process, you have to a certain approach, hit a wall, go back and try another route. What I do is documenting this gained knowledge and publishing it in one place. It can save other people’s time by explaining why something is not working. And I myself sometimes go back to my blogpost to see how exactly I did certain things in the past.
One of your most well known projects is called Rock’N’Poll. Why do you think there is potential in explanatory journalism?
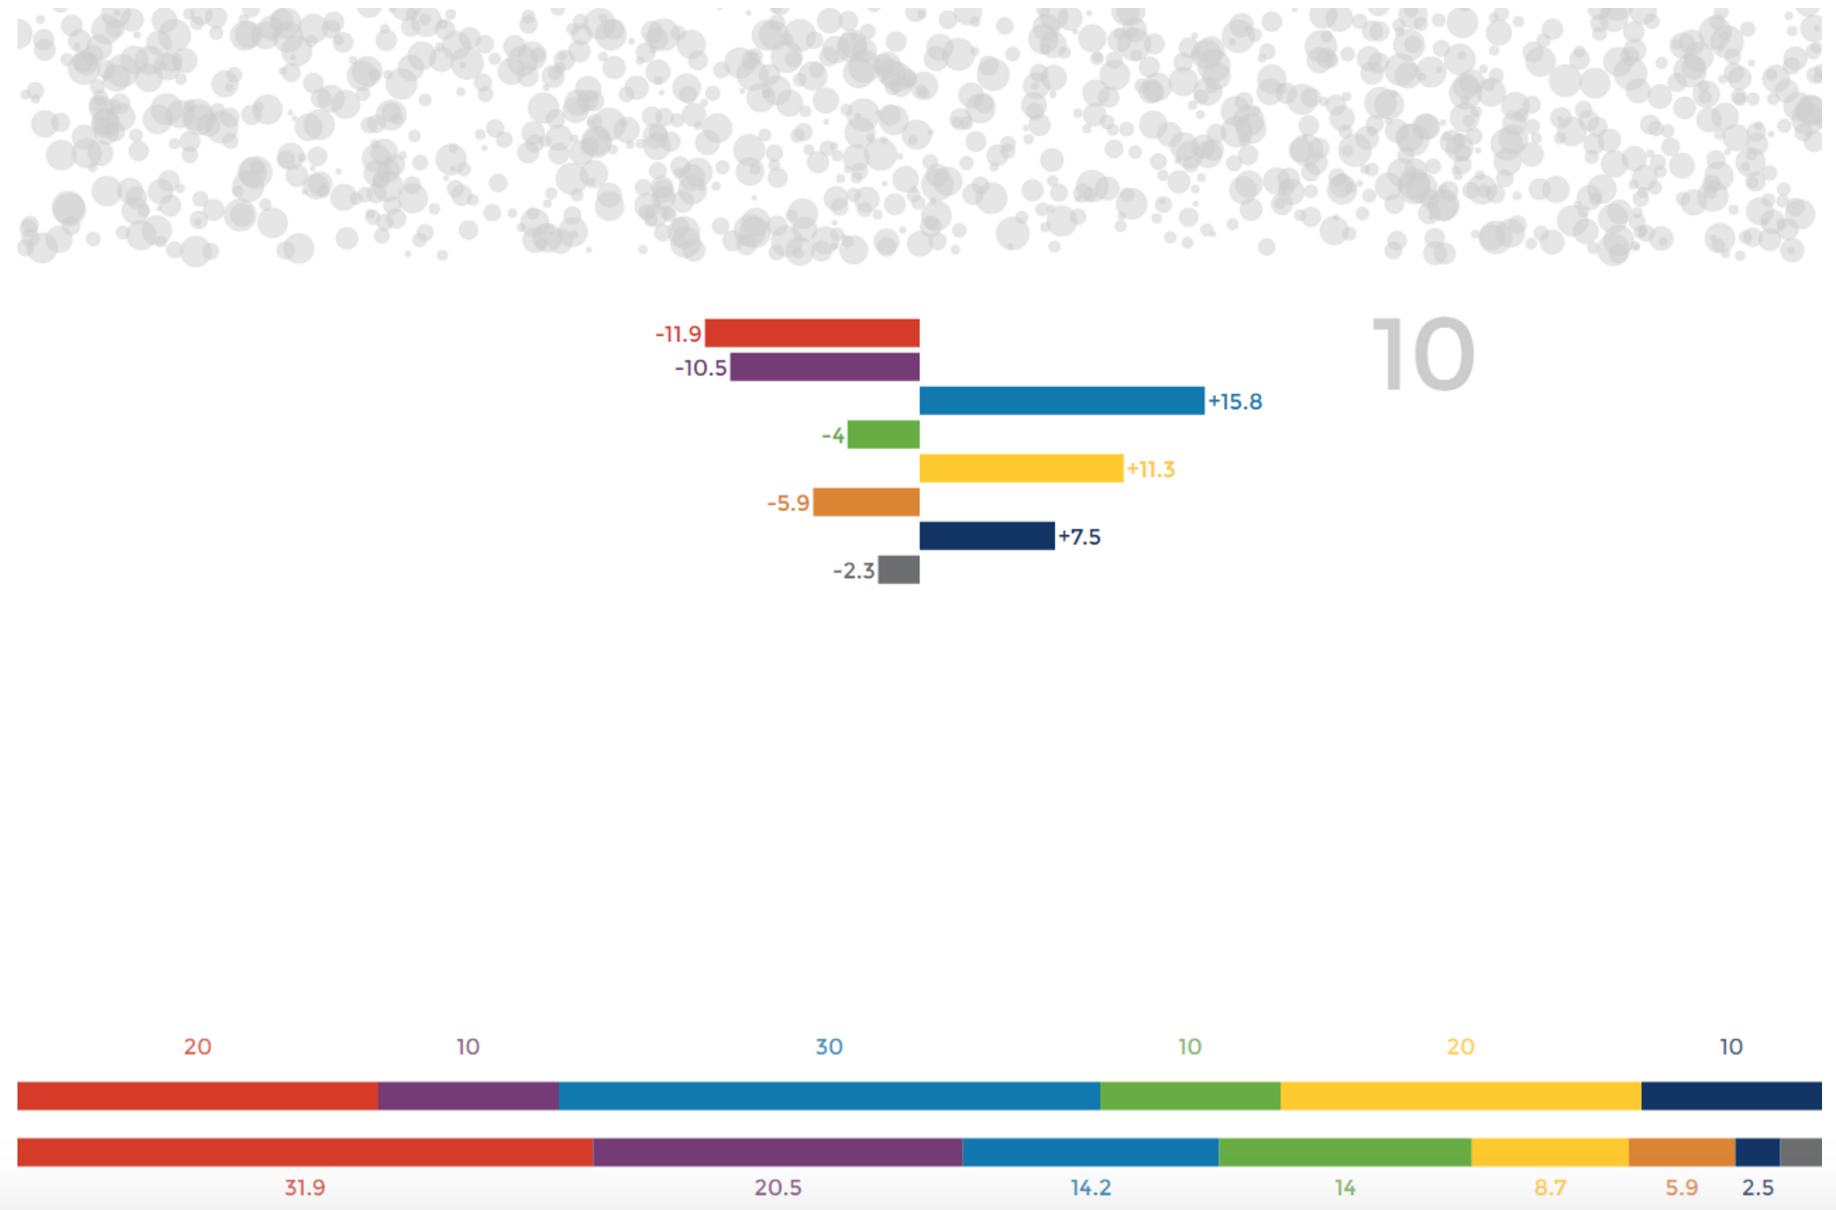
Screenshot of the ‘Rock’n’Poll’ project
It was a special project, and it’s not a coincidence that I made a Flemish and an English website, I wanted to reach out to both communities. I do believe that we can create interactive visualizations that explain very complex things like political polls while retaining the uncertainty that goes with it. The term for it, ‘explorable explanation’, was coined by Bret Victor in his homonymous essay. It means people that play with the product and while playing they are learning about it step by step; in the end they can understand very big and complex concepts, because they were able to change certain things and see how this affects other things. I think this can be a very powerful technique which is still underused.
And do you think data journalism in general is doing its job of explaining complex issues to mass audience, or is it still a niche product?
There will always be specific products like those that The Guardian and New York Times are making which have a certain public, the wealthy elite. But I also think that we, as part of the media, have a role in educating readers on graphicacy – a term used by Alberto Cairo and it means being able to understand graphics, maps and visually encoded information. That is also a vital part of data journalism in my opinion – using numbers in a good way, without distorting reality which leads to misleading conclusions. So we are responsible in educating society on how to read these graphics.
Are there a lot of data journalists in Belgium? I would love to have more data driven colleagues in the industry, for sure. But I am sure that a lot of people working in business intelligence do very similar things. Maybe they don’t invest as much in storytelling and visualizing as I do, but there are certainly other profiles with similar knowledge and skills, only they are not in the newsrooms today.
What can be done to improve the journalist eco-system?
I think one solution can be to hire people outside of the classic journalism schools, what you already see in all the big newsrooms of the UK and the US, people working as data journalists have a background in other fields. Another solution could be to show what is possible, and when the high executives in the media company see what can be done with data it will trickle down back to the newsroom and they will attract more people who are familiar with working with data.
And what about traditional journalists, student journalists?
I read once that the problem with journalists in relation to data & technology is that they have a background in language education, so they are used to look for the solutions in books. But with data & new technologies, you have to experiment, hit walls, know how to search for solutions on the internet. So there are two different systems, and it’s not easy to switch from one to another. If you want to become a data journalist, you should start thinking like a programmer.
Featured photo: Maarten Lambrechts as a member of the awards jury at the the 24th edition of the Malofiej Infographics World Summit in Pamplona, Spain, source: Maarten Lambrechts
Written by


Share